
Most speaker specs are built to impress people who don't listen past the brochure. Frequency response isn't a brag about how low or high a speaker can go, it's a map of how that speaker behaves across the whole band, and the map is what your ears inherit. A box that claims a wide range can still sound lumpy, bright, thin, or bloated if the curve between the endpoints is badly shaped, which is why the industry treats tolerance, not just endpoints, as the load-bearing part of the spec. Sound On Sound's explanation of speaker specifications
That's the part marketing loves to blur. What is frequency response in speakers? It's not a single number, and it's not just “can it reach 20 Hz.” It's the shape of output across frequency, usually plotted in hertz and decibels, and the shape is where the truth lives. If you've ever heard two speakers with the same quoted range sound completely different, that's not mysticism. That's the curve.
Table of Contents
- Frequency Response Is a Shape, Not a Span
- Reading the Curve Like a Tonal Blueprint
- Why Spec Sheets Lie Without Lying
- The Off-Axis Problem Nobody Talks About
- Anechoic Chambers Versus Your Living Room
- What Frequency Response Cannot Tell You
- How to Buy Speakers Without Getting Burned
Frequency Response Is a Shape, Not a Span
A speaker spec that says 20 Hz to 20 kHz sounds decisive, but by itself it tells you almost nothing useful. That range is the headline. The headline is not the story. The story is the contour between those endpoints, the little hills and valleys that decide whether the speaker sounds even-handed or cooked.

Think topographic map, not bumper sticker
I like to think of frequency response as a tonal blueprint. A flat or smoothly contoured line means the speaker is trying to reproduce bass, mids, and treble at roughly equal loudness. Peaks push certain notes forward. Dips pull them back. That's why two speakers can share the same quoted range and still sound like they were built in different planets.
The industry's obsession with tolerance makes sense here. A bare number like 50 Hz to 20 kHz is close to meaningless without context, while a tighter spec such as ±3 dB gives you a real picture of tonal balance. One source puts it bluntly, a range without a dB qualifier is “meaningless and useless”, and recommends the form X Hz to Y kHz ±3 dB for actual comparison (Axiomaudio on frequency response specs).
Practical rule: if the spec sheet gives you endpoints but hides the tolerance, assume the useful part of the story is missing.
That's the part buyers keep getting sold short on. Not because every manufacturer is dishonest. Because the simpler number looks cleaner on a box. Cleaner sells. Cleaner also starves the signal of context.
Reading the Curve Like a Tonal Blueprint
A response curve is a diagnostic, and once you read it that way, the plot starts telling you what the speaker will do to voices, cymbals, kick drum, and piano. The spec sheet is often sold like a trophy. That is the wrong lens.
Peaks and dips change the character fast
A bass rise adds weight and can make a small speaker feel larger than it is. Push that shelf too far and the midrange gets covered in wool. A dip in the upper mids can push vocals back in the room, which some listeners hear as refinement and others hear as distance. Treble peaks are the quickest route to fatigue because they place glare right where the ear is already touchy.
That is why tonal balance matters more than the quoted span. A response that stays smooth tends to sound neutral. A response that swerves sounds colored. A source focused on tonal balance makes the same point, the curve shows whether a speaker is reproducing bass, mids, and treble at roughly equal loudness, while the decibel variation shows whether the output will read as neutral or colored (Miscospeakers on frequency response and sound quality).
Small deviations are one thing. Bigger swings are another.
There is a reason serious audio listeners do not panic over every wiggle. Deviations of 1 to 3 dB are generally normal, but once you get to 4 dB and up, the changes become increasingly irritating, especially higher up where the ear is less forgiving. That does not mean every 3 dB dip is harmless. It means your ears usually tolerate modest contouring, but they stop being polite once the curve starts slapping the treble around.
If you have heard the classic BBC-style upper-mid recession, a rising treble tilt, or a bass shelf that makes everything sound overweight, you have heard response shape doing the work. Not the range. The shape.
A curve tells on itself.
See our detailed guide on speaker crossover frequencies here: speaker crossover frequencies
Why Spec Sheets Lie Without Lying
Manufacturers do not need to invent a thing to mislead you. They only need to leave out the part that matters most. A speaker listed as 34 Hz to 22 kHz may be technically accurate, but without the tolerance attached, that line could be useful, loose, or basically decorative.
Read the spec like a lawyer, not a fan
Look for the dB qualifier first. 20 Hz to 20 kHz ±3 dB is a much stricter promise than a bare range, because it says the output stays within 3 decibels of the reference line across that span. If the manufacturer leaves out the tolerance, you do not have enough information to compare the speaker against anything else.
The missing detail is the whole trick. A low number on paper means little if the speaker is already far off the line before it reaches that point. A quoted extension figure without context can be all theater and no floor.
Same endpoints, different reality
| Speaker Model | Quoted Range | Tolerance | Usable Bass Extension | Tonal Balance |
|---|---|---|---|---|
| Model A | 20 Hz to 20 kHz | ±3 dB | Broad and credible | Fairly even |
| Model B | 20 Hz to 20 kHz | Not stated | Unknown from the spec alone | Impossible to judge |
| Model C | 34 Hz to 22 kHz | Not stated | Unknown from the spec alone | Impossible to judge |
| Model D | 20 Hz to 20 kHz | Wider than ±3 dB | May look extended while sounding uneven | Potentially colored |
That table is the whole game. Same endpoints do not mean the same performance. Specs without tolerance are marketing prose wearing measurement clothes. A range alone can hide the exact problem buyers are trying to avoid, because it never says how much of that range sounds even, and how much of it is hanging on by a thread.
The Off-Axis Problem Nobody Talks About
Most buyers stare at the on-axis curve and stop there. That's a mistake. The direct sound from the speaker is only part of what reaches your ears, and the rest of the room does its own damage and repair on the way in. Off-axis behavior changes the tonal balance you hear, which is why a flat-looking speaker can still sound bright, hollow, or strangely alive in a room.
Directivity is the missing half of the curve
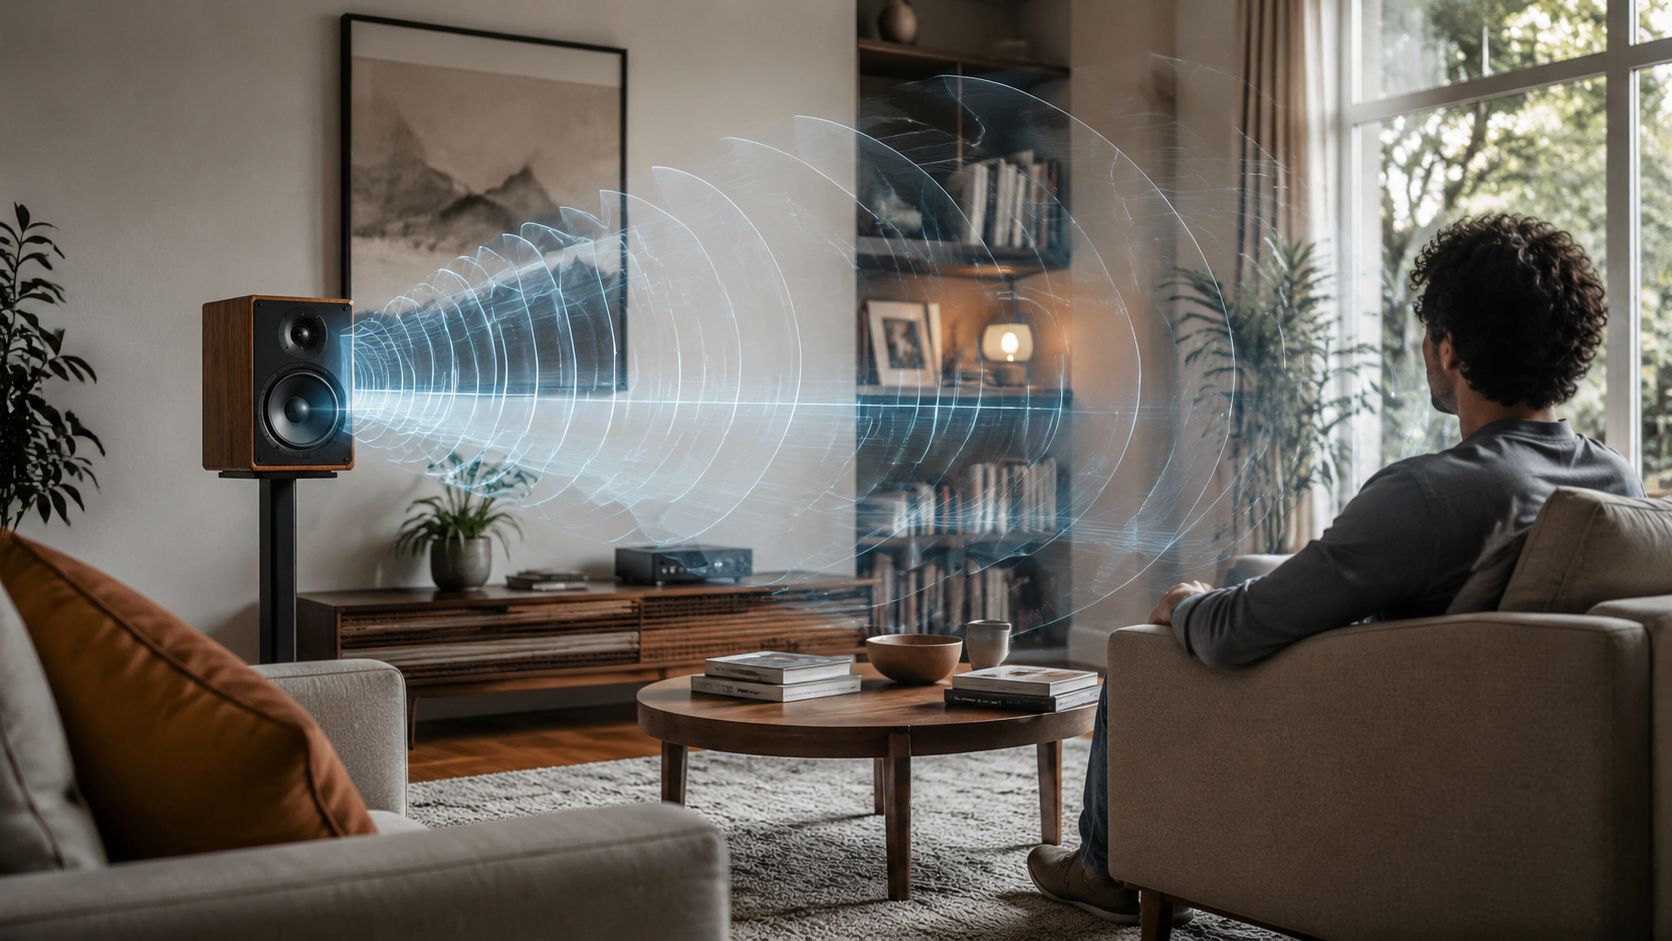
Technical sources define directivity as the way frequency response changes at off-axis angles, and they're right to treat it as central, not optional. If the speaker stays similar as you move off-axis, the room reflections sound like the direct sound. If the off-axis response gets ragged, the reflections take on a different tone, and the room starts rewriting the speaker's voice.
That matters because most listening isn't dead-center in a treated chamber. You lean. You swivel. You sit a little off to one side. Toe-in changes the mix between direct and reflected sound. Seating position changes it again. The same speaker can sound tidy in one chair and edgy in another.
A room-based guide to speaker placement gets at the same point from the practical end, because bass and balance both change when you move the box and the listener around the room (Supermarket Sound on speaker placement and bass).
The curve on the datasheet is not the whole listen. Downstream inherits the room.
A short video is useful here
A lot of people only trust this after they hear it mapped against a real space.
If the speaker's directivity is well behaved, the room tends to preserve its character. If not, every wall becomes a tone control you didn't ask for.
Anechoic Chambers Versus Your Living Room
Anechoic data strips the room away, making it useful for one narrow job: reading the speaker itself. It also leaves out the part that gets heard. A living room is never blank, and it never behaves like a lab. In-room response is intentionally not flat, because reflections, boundary gain, and room modes reshape the balance before it reaches your ears.
Flat on paper, not flat in the room
Bass rises near walls and corners. High frequencies get absorbed by furniture, curtains, and the ordinary soft clutter of a real room. That means a speaker with a little bass roll-off can sound balanced in a normal space, while a speaker that looks ruler-flat in a chamber may sound too thick or too lean once placement and room loading start working on it.
That is why a clean-looking anechoic line can mislead buyers. The chamber tells you what the speaker does in isolation. The room tells you what reaches your ears. Those are different things. Measurement-focused writing has made that point for years, because the in-room curve is meant to include the room's own shape, not pretend it does not exist.
Placement is part of the response
If a speaker sounds different in two homes, placement is usually the first place to look. Push it too close to boundaries and the low end swells. Pull it farther out and the balance can thin. I have heard modest speakers settle into a much better balance just by getting out of corners and away from strong early reflections, which is why placement belongs in the conversation from the start.
For a practical placement lens, the useful advice still comes down to room symmetry, sensible spacing, and enough breathing room for the bass to settle, as outlined in Supermarket Sound on speaker placement and bass.
Anechoic graphs matter. So do the walls around you. The room gets the last word.
What Frequency Response Cannot Tell You
Frequency response matters, but it only describes part of a speaker. A speaker can trace a respectable curve and still sound off because the curve is one piece of a much larger system. Directivity, bass-room interaction, crossover behavior, time-domain behavior, and distortion all matter.
A smooth line can hide ugly behavior
A speaker that looks tidy on paper can still smear transients, shift imaging, or fall apart when you push it. Measurement-focused writing keeps repeating that point because real rooms expose problems that a simple response plot does not. Frequency response alone is an incomplete guide unless you also look at how the speaker radiates, how the drivers blend, and how it behaves once the room starts adding its own fingerprints.
That is why I do not trust the old habit of treating a pretty curve as proof of greatness. A speaker can measure “better” and still sound worse to you if its crossover is awkward, its off-axis output falls apart, or its bass loads your room in an ugly way. The ear does not care whether the chart looks clean. The ear cares whether voices stay locked in place and cymbals keep their sheen instead of turning brittle.
Match the tool to the job
For home listening, tonal balance and room behavior matter more than a heroic endpoint spec. For nearfield use, the speaker's close-up behavior and directivity window matter more than a poster-worthy range. For a room-based system, what you hear is the combined result of the speaker and the space, not the bench printout. If you are comparing studio monitors with domestic speakers, this breakdown of studio monitors vs speakers helps frame why the same frequency plot can mean different things in different setups.
That is why I prefer people to listen for texture, weight, and image stability first, then check measurements as a reality test. A graph can tell you a lot. It cannot tell you everything. Not even close.
How to Buy Speakers Without Getting Burned
Start by ignoring the shiny endpoint number unless it comes with tolerance. A bare 20 Hz to 20 kHz line is not enough. A 20 Hz to 20 kHz ±3 dB line is a real claim. Anything else needs more skepticism than most brochures can survive.
What to trust and what to discount
Trust measurements that show dB tolerance, on-axis behavior, and, when possible, off-axis or room-aware data. Discount endpoint claims that don't say how flat the speaker really is. Discount marketing language about “reaching” low bass if nobody shows how much output is present. And don't expect EQ to rescue a speaker from every problem. EQ can correct broad tonal imbalance. It can't fix poor directivity, bad crossover behavior, or the way a room and speaker fight each other.
Buy the behavior, not the slogan.
For different use cases, the priorities shift. Nearfield listening rewards stable direct sound and predictable off-axis behavior. Living room systems live or die on room interaction and placement. Home theater asks the speaker to stay coherent when the space gets loud and reflective. The right choice depends on which of those jobs you're asking the box to do.
If you want the blunt version, it's this. Read the tolerance. Care about the curve. Respect the room. Then listen before you fall in love with the spec sheet.
If you want more plain-English speaker breakdowns that treat measurements like tools instead of worship objects, keep reading Supermarket Sound. That's where I'll keep separating the useful numbers from the brochure fog, one honest listen at a time.

